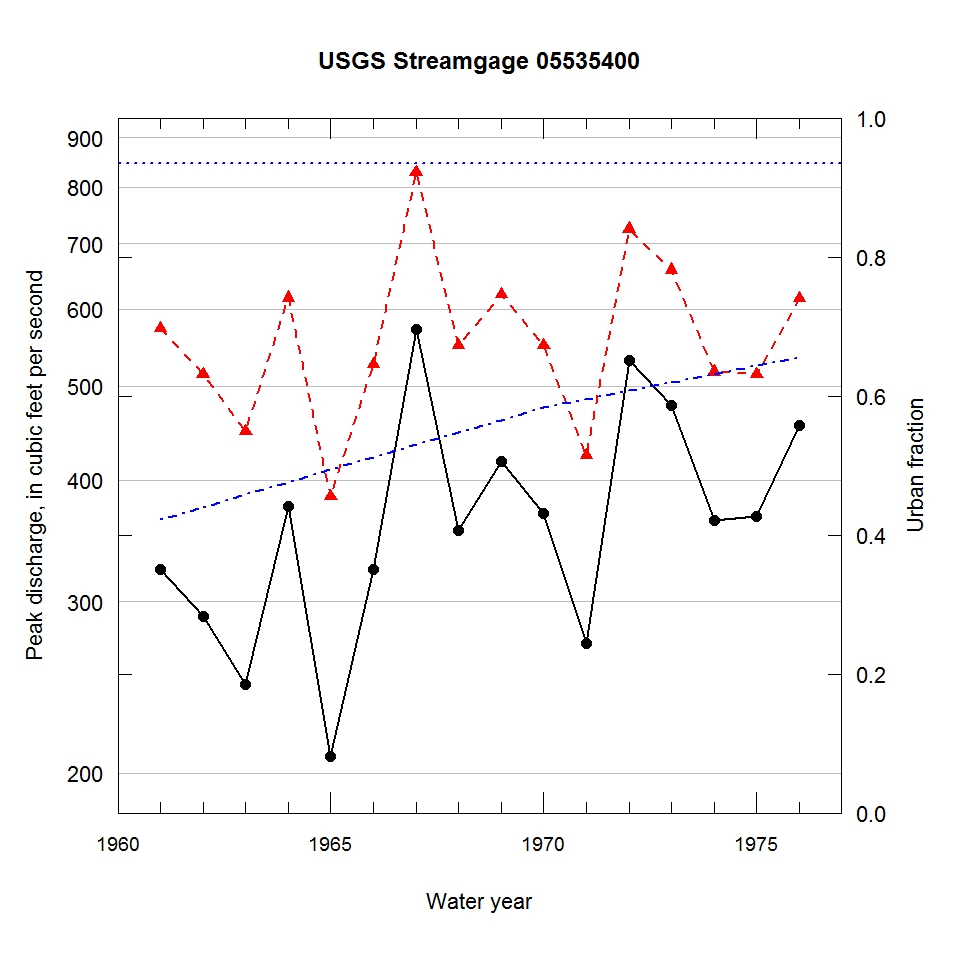
Observed and urbanization-adjusted annual maximum peak discharge and associated urban fraction and precipitation values at USGS streamgage:
05535400 WF OF NB CHICAGO RIVER AT DEERFIELD, IL


| Water year | Segment | Discharge code | Cumulative reservoir storage (acre-feet) | Urban fraction | Precipitation (inches) | Observed peak discharge (ft3/s) | Adjusted peak discharge (ft3/s) | Exceedance probability |
| 1961 | 1 | -- | 0 | 0.423 | 1.783 | 324 | 573 | 0.474 |
| 1962 | 1 | -- | 0 | 0.440 | 0.248 | 290 | 514 | 0.582 |
| 1963 | 1 | -- | 0 | 0.458 | 1.121 | 247 | 449 | 0.712 |
| 1964 | 1 | -- | 0 | 0.476 | 1.792 | 376 | 616 | 0.400 |
| 1965 | 1 | -- | 0 | 0.494 | 0.498 | 208 | 385 | 0.826 |
| 1966 | 1 | -- | 0 | 0.512 | 1.315 | 324 | 526 | 0.557 |
| 1967 | 1 | -- | 0 | 0.530 | 1.492 | 571 | 829 | 0.155 |
| 1968 | 1 | -- | 0 | 0.548 | 1.174 | 355 | 550 | 0.515 |
| 1969 | 1 | -- | 0 | 0.565 | 1.286 | 418 | 621 | 0.391 |
| 1970 | 1 | -- | 0 | 0.583 | 1.330 | 370 | 550 | 0.514 |
| 1971 | 1 | -- | 0 | 0.595 | 0.387 | 272 | 424 | 0.759 |
| 1972 | 1 | -- | 0 | 0.607 | 0.690 | 531 | 725 | 0.229 |
| 1973 | 1 | -- | 0 | 0.619 | 1.387 | 477 | 658 | 0.321 |
| 1974 | 1 | -- | 0 | 0.631 | 1.035 | 364 | 517 | 0.575 |
| 1975 | 1 | -- | 0 | 0.644 | 0.963 | 367 | 514 | 0.580 |
| 1976 | 1 | -- | 0 | 0.656 | 0.960 | 455 | 615 | 0.403 |

